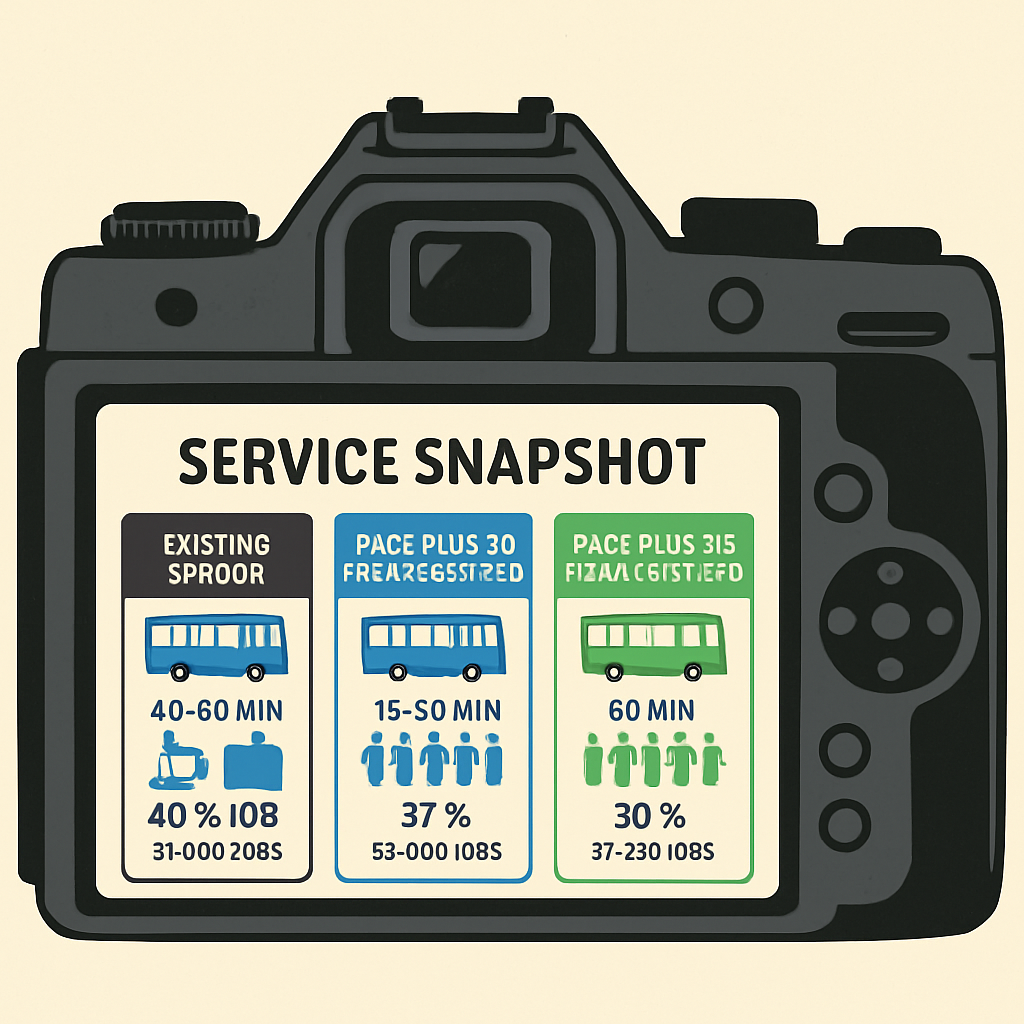
Each funding scenario leads to very different outcomes — in how often buses come, how many people live near service, and how many jobs riders can reach.
Here’s a snapshot of what changes under each concept:
42% of jobs
42% of jobs
37% of jobs
56% of jobs
7% Increase
86% Increase
30% Increase
A few more routes
Nearly all routes
A few more routes
Most routes
Only a few
Maintains Increased Frequency
Most routes run on Sunday
Maintains Increased Frequency
Maintains Increased Frequency
Each version reflects a trade-off — between frequency, coverage, and access. With more investment, the region gains flexibility to serve both goals better.